

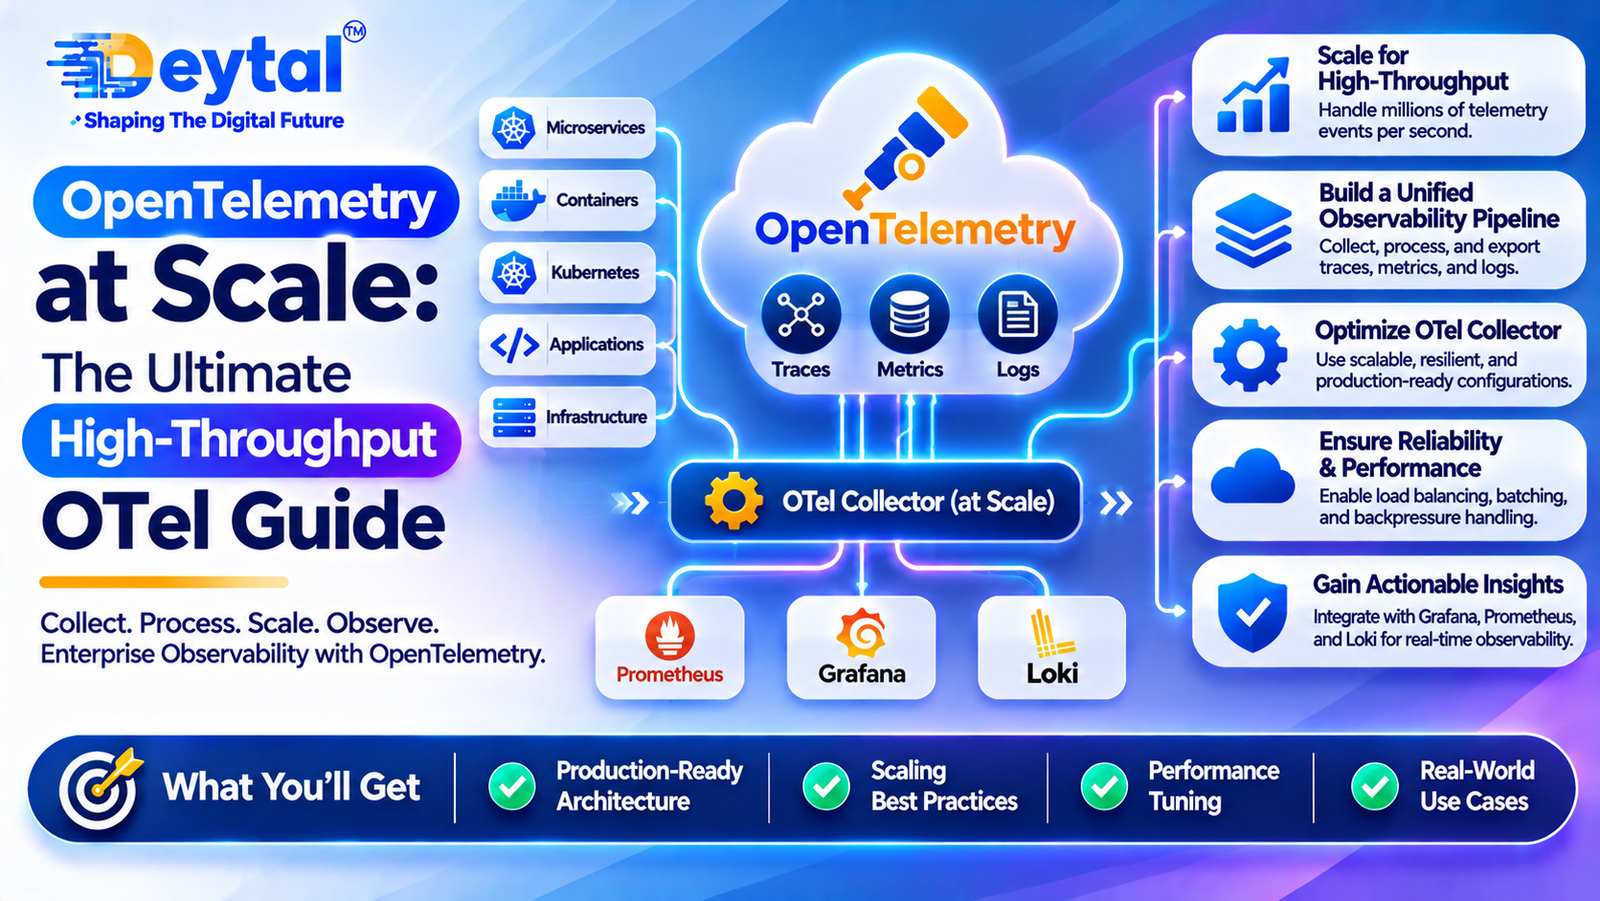
Modern cloud-native platforms generate an unprecedented volume of diagnostic telemetry. As monolithic applications decompose into hundreds of distributed microservices running across dynamic Kubernetes clusters, tracking request lifecycles, identifying performance regressions, and debugging cross-service failures become impossible without distributed tracing and fine-grained metrics. Historically, this forced enterprises into deep vendor lock-in, embedding proprietary agent SDKs directly into application runtimes and paying exorbitant ingest fees for low-value, duplicate telemetry.
The Cloud Native Computing Foundation’s (CNCF) OpenTelemetry (OTel) project has permanently dismantled this vendor-dominated paradigm by providing a unified, vendor-agnostic standard for collecting, processing, and exporting traces, metrics, and logs.
However, operating OpenTelemetry at Scale introduces serious distributed systems challenges. At enterprise scale processing hundreds of gigabytes or terabytes of telemetry per minute naive agent setups cause memory leaks, backpressure collapses, network congestion, and runaway SaaS observability bills. Taming this data flood requires architecting a resilient, two-tier High-Throughput OpenTelemetry Collector Topology, combining decentralized local daemons with a scalable processing gateway powered by load-balanced routing and intelligent tail-based sampling.
The Structural Failure Modes of Unoptimized Telemetry Pipelines
Treating distributed telemetry as an unmanaged exhaust stream inevitably results in severe platform and financial vulnerabilities:
- High-Cardinality Metric Explosions: When developers attach arbitrary runtime metadata (such as user IDs, raw URLs with query parameters, or transaction IDs) to metric labels, downstream time-series storage indexes fragment rapidly, spiking query latency and driving cloud storage bills exponentially higher.
- Prohibitive SaaS Ingest Costs via Head-Based Sampling: Deciding whether to keep or drop a trace at the initial ingress point (head-based sampling) forces teams to make a blind trade-off: sample at 1% and miss critical, intermittent 500-series HTTP errors, or sample at 100% and exhaust their observability budget on healthy
200 OKhealth checks. - Client Runtime Overhead & Memory Bloat: Application instances running heavy in-process batching and remote network exporters consume valuable CPU cycles and heap space. When downstream backends lag, memory pressure in the application process risks triggering out-of-memory (OOM) kills.
- Collector Cascade Failures Under Backpressure: Deploying monolithic, single-tier OTel Collector instances without memory limiters, persistent file-based queues, or dynamic retry loops leads to cascading failure loops under traffic spikes, permanently dropping mission-critical audit trails and latency traces.
Direct In-App Exporters vs. Two-Tier OTel Collector Architecture
| Architectural Dimension | Direct In-App Exporter Model | Two-Tier Enterprise OTel Collector Topology |
| Telemetry Transport | Application pods export directly to remote vendor APIs | App pods send via localhost gRPC/OTLP to DaemonSet, routed to Gateway tier |
| Application Resource Impact | High; app pods manage connection pools, retries, and batch buffers | Minimal; near-zero latency localhost handoff frees application CPU/heap |
| Sampling Paradigm | Static head-based sampling configured at app startup | Intelligent tail-based sampling evaluated across the complete distributed trace |
| Secret & Credential Management | API keys distributed across hundreds of individual microservices | Centralized exclusively within secure, private Gateway Collector instances |
| Data Scrubbing & PII Redaction | Fragmented; requires custom code across multiple application languages | Standardized via Collector processors (attributes, transform, regex filtering) |
| Vendor Portability | Extreme lock-in; swapping backends requires code updates and redeployments | Absolute decoupling; swap, add, or fork storage backends via YAML pipeline configs |
| Backpressure Resilience | Weak; network hiccups cause app slowdowns or data drops | Robust; managed via memory-limiter processors and disk-backed queues |
Strategic Pillars for Engineering OpenTelemetry at Scale
1. Scalable Collector Gateways & Tail-Based Sampling Engines
Tame high-throughput distributed tracing by deploying a two-tier collector topology: node-level DaemonSets for fast, local in-memory reception, and auto-scaling Gateway StatefulSets for heavy compute processing. Developing custom trace processors, memory-limiter protections, and load-balancing exporters through Custom Software Development Services ensures complete trace reconstruction, retaining 100% of error paths and latency outliers while discarding routine traffic.
2. Interactive Observability Portals & Telemetry Web Dashboards
Empower site reliability engineers (SREs) and system developers with unified trace exploration platforms that render real-time service dependency graphs. Constructing responsive internal consoles, distributed span visualizers, and interactive waterfall charts via Website Development Services ensures technical teams pinpoint cross-service microservice latency bottlenecks in milliseconds.
3. Observability UX & Telemetry Health UI/UX Design
Complex telemetry pipelines become operational liabilities if engineers cannot quickly interpret collector health. Designing intuitive pipeline routing visualizers, span-to-metric correlation views, and collector throughput dashboards through UI/UX Design Services bridges the gap between deep infrastructure instrumentation and rapid incident resolution.
4. Low-Overhead Telemetry SDKs for Mobile Applications
Capturing real-world mobile client telemetry without draining user batteries or consuming cellular bandwidth requires strict instrumentation discipline. Building optimized mobile OTel wrappers, crash session recording pipelines, and bandwidth-throttled batch senders via Mobile App Development Services guarantees distributed traces seamlessly link front-end mobile clicks directly to downstream cloud microservices.
5. Clean Ingress Telemetry & Search Engine Performance Architecture
Ensure deep APM tracing, real-user monitoring (RUM) scripts, and edge collector agents do not degrade public core web performance, TTFB, or search visibility. Operating fast, lightweight publishing platforms with optimized asset bundling through WordPress Development Services coupled with data-backed SEO Services maintains top organic search authority and lightning-fast page loading speeds.
6. Enterprise Reliability Signaling & Operational Trust Positioning
Translate enterprise-grade observability practices, five-nines platform availability, and strict telemetry privacy compliance into clear competitive advantages during enterprise B2B sales cycles, backed by conversion-optimized growth funnels managed by Digital Marketing Services.
Optimize Your Observability Platform with Deytal Technologies
Scaling OpenTelemetry across large-scale distributed architectures requires deep systems expertise in OTLP routing, memory-limiter configurations, and high-throughput trace processing. Deytal Technologies Pvt. Ltd. designs, audits, and deploys production-ready OpenTelemetry pipelines, scalable OTel Collector topologies, and tail-based sampling architectures engineered to deliver deep platform visibility while slashing enterprise observability cloud costs by up to 60%.
Frequently Asked Questions (FAQ)
Q1: What is the architectural difference between head-based and tail-based sampling?
Head-based sampling makes the decision to keep or discard a trace at the very beginning of a request (usually at the root API gateway or client app), before knowing whether the downstream transaction will succeed or fail. Tail-based sampling collects all spans belonging to a trace, buffers them until the entire request lifecycle completes, and then evaluates the full trace against configured rules. If any downstream span returns an HTTP 5xx error, an unhandled exception, or exceeds a latency threshold (e.g., >500ms), the entire trace is preserved; otherwise, it is safely dropped.
Q2: Why is a two-tier OTel Collector architecture essential for tail-based sampling?
Tail-based sampling requires all spans that share the same TraceID to arrive at the exact same collector instance to assemble the full trace picture. In a multi-node Kubernetes cluster, different microservices handling the same request will emit spans to different local nodes. A two-tier setup solves this: the local agent (Tier 1) receives spans from local pods and forwards them to a loadbalancingexporter, which hashes the TraceID and consistently routes all related spans to the same backend Gateway Collector (Tier 2) where the sampling logic runs.
Q3: How do we prevent OTel Collectors from crashing under sudden high-volume traffic spikes?
Protecting collector availability requires configuring three core pipeline components:
- Memory Limiter Processor: Must be placed as the first processor in every pipeline. It constantly tracks memory utilization, dropping or delaying data if usage crosses high-water thresholds (e.g., 80% of container limit) before an out-of-memory panic occurs.
- Persistent Queueing: Configure the
batchprocessor alongside file-storage or disk-backed queues to absorb bursts without exhausting container RAM. - Horizontal Pod Autoscaling (HPA): Scale Gateway Collector instances based on custom Prometheus metrics, such as collector CPU saturation or incoming OTLP request rates.
