

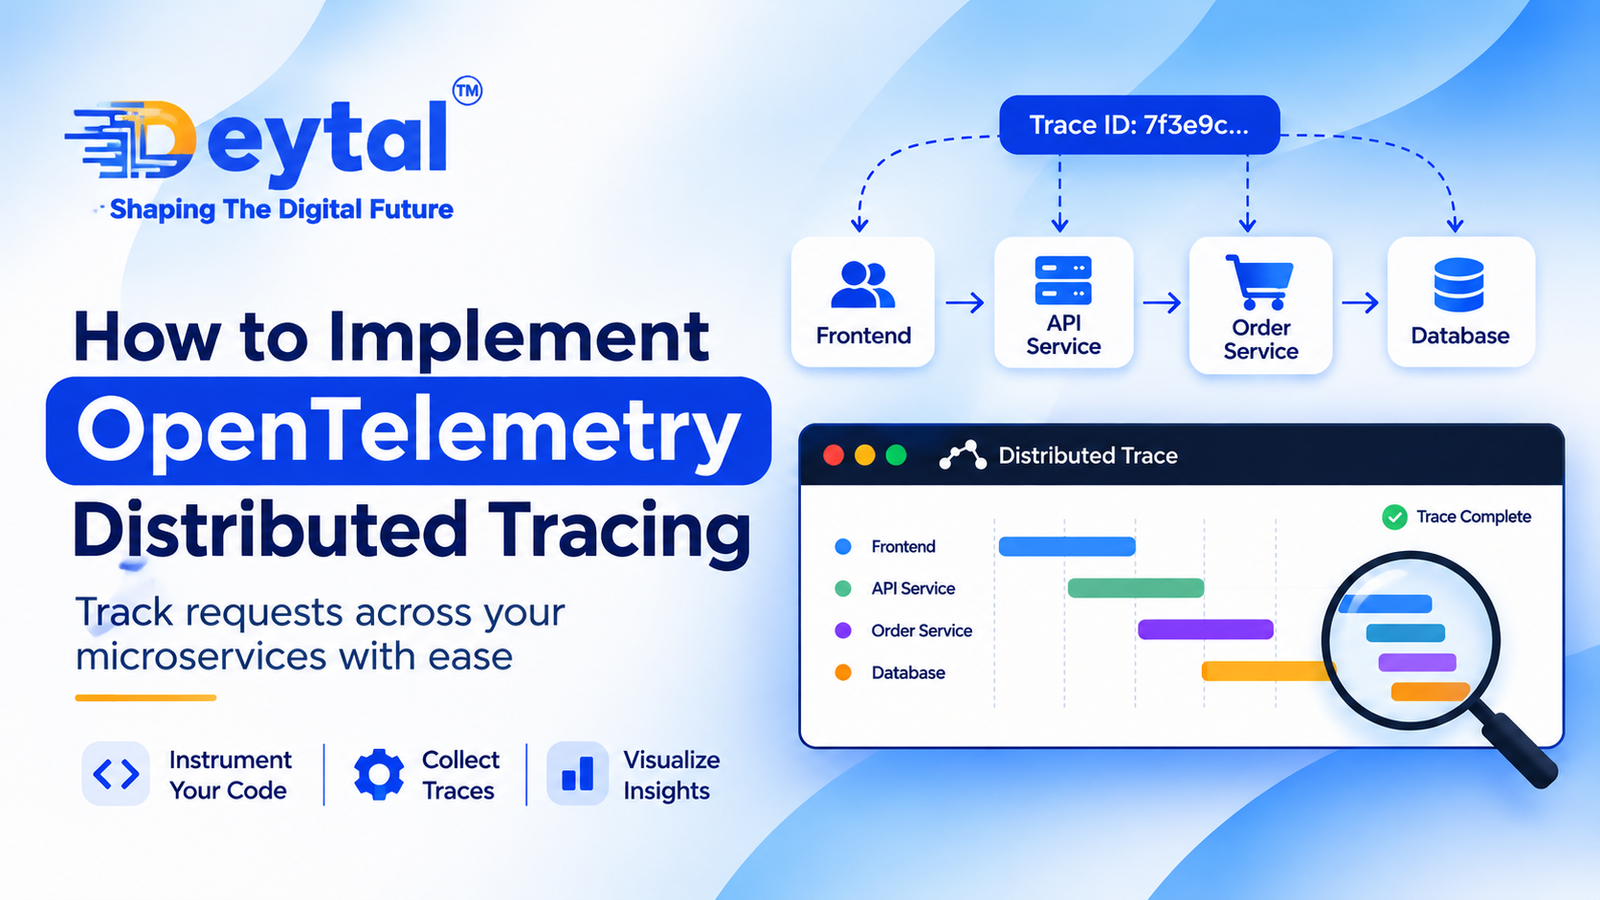
In monolithic architectures, troubleshooting application latency or runtime exceptions was relatively straightforward: an engineer could pull a unified server log, inspect the stack trace, and pinpoint the failing database query or thread lock. In distributed enterprise microservice architectures, a single end-user action—such as executing an e-commerce checkout or submitting a loan application—often fans out into dozens of asynchronous HTTP/REST, gRPC, and message broker interactions across disparate infrastructure nodes and private cloud networks.
When downstream latencies spike or transactions intermittently fail, isolated server logs and aggregate infrastructure metrics provide little context. Enterprise OpenTelemetry Observability solves this visibility gap by establishing an open-source, vendor-neutral telemetry standard for collecting, processing, and exporting distributed traces, metrics, and logs. By implementing consistent W3C trace context propagation, resilient OpenTelemetry Collector pipelines, and intelligent tail-based sampling, enterprise platform teams can isolate transient performance anomalies across polyglot microservice fleets in real time.
The Operational Failures of Fragmented Telemetry Stacks
Relying on disparate, proprietary APM agents and siloed monitoring tools introduces systemic operational friction:
- Vendor Lock-in and Cost Explosion: Proprietary observability vendors charge exorbitant data ingestion rates for uncompressed, un-sampled telemetry, making full-scale tracing financially unsustainable as transaction volumes surge.
- Context Fragmentation Across Service Boundaries: When each service team adopts a different logging framework or APM agent, trace identifiers are dropped across HTTP headers, breaking the end-to-end execution chain into disconnected fragments.
- Agent Resource Contention: Heavyweight, closed-source APM agents run deep byte-code instrumentation within production containers, causing unpredictable memory consumption and CPU spikes during high-throughput workloads.
- High-Cardinality Blindspots: Traditional metrics aggregate values into broad statistical counters, dropping critical contextual attributes (such as
tenant_id,order_id, orregion_id) needed to isolate failures affecting individual high-value accounts.
Proprietary APM Monitoring vs. Enterprise OpenTelemetry Observability
| Observability Dimension | Legacy Proprietary APM Monitoring | Enterprise OpenTelemetry Observability |
| Telemetry Standard | Closed-source, vendor-specific agent SDKs | Open-source, CNCF-governed vendor-agnostic framework |
| Backend Portability | Locked to a single commercial SaaS vendor | Dual-export to multiple backends (Jaeger, Prometheus, Datadog, Grafana) |
| Context Propagation | Proprietary headers; breaks across foreign systems | Standardized W3C Trace Context (traceparent, tracestate) |
| Sampling Control | Rigid head-based sampling configured by vendor rules | Flexible head- and tail-based sampling via OpenTelemetry Collector |
| Data Ingestion Costs | Pay-per-gigabyte pricing with high overhead | Local filtering, deduplication, and aggregation before export |
| Agent Footprint | Dynamic runtime monkey-patching; high overhead | Lightweight, compile-time/runtime SDKs with low CPU footprint |
Strategic Pillars for Engineering an OpenTelemetry Observability Architecture
1. Standardized Context Propagation & Custom Gateway Instrumentation
Ensure every incoming user interaction receives an immutable trace identifier that survives distributed hops across API gateways, service meshes, and message queues. Engineering custom interceptors, W3C header injectors, and Kafka header propagators through Custom Software Development Services ensures end-to-end lineage across asynchronous microservice boundaries.
2. Real-User Monitoring (RUM) & Client-Side Trace Federation
Correlate frontend user interactions directly with backend database queries. Integrating OpenTelemetry browser SDKs into client-side web platforms via Website Development Services links button clicks and route transitions to backend API traces, pinpointing whether latency stems from the browser main thread or upstream microservices.
3. Ergonomic Telemetry Dashboards & Incident UX Design
Data is useless if platform engineers cannot parse it during production triage. Designing intuitive service dependency maps, interactive flame graphs, and clear error-budget telemetry cockpits through UI/UX Design Services accelerates Mean Time to Resolution (MTTR) and minimizes cognitive fatigue for site reliability engineering (SRE) teams.
4. Mobile Network Observability & Crash-Trace Correlation
Trace network requests originating from mobile devices under unpredictable cellular conditions. Integrating lightweight mobile telemetry SDKs into iOS and Android runtimes via Mobile App Development Services correlates dropped packets, native crashes, and local offline database states with centralized enterprise trace backends.
5. Clean Edge Ingestion & Search Performance Continuity
Ensure dynamic CMS content delivery and API feeds maintain peak execution speeds without observability overhead degrading Time to First Byte (TTFB). Deploying streamlined headless content delivery pipelines through WordPress Development Services coupled with data-driven SEO Services maintains top organic search authority, fast indexing, and optimal Core Web Vitals.
6. Product-Driven SLO Tracking & High-Trust Customer Funnels
Leverage fine-grained trace latency percentiles (P95/P99) to validate strict Service Level Objectives (SLOs) and customer contractual uptime guarantees, building client confidence through high-authority Digital Marketing Services.
Master Enterprise Observability with Deytal Technologies
Migrating an enterprise to a vendor-neutral OpenTelemetry architecture requires robust telemetry collector pipelines, custom context propagation design, and cost-effective trace sampling policies. Deytal Technologies Pvt. Ltd. designs, audits, and builds production-grade observability platforms, distributed tracing pipelines, and high-performance cloud applications engineered for total system visibility, zero vendor lock-in, and rapid incident resolution.
Frequently Asked Questions (FAQ)
Q1: What is the primary role of the OpenTelemetry Collector?
The OpenTelemetry Collector is a proxy component that receives, processes, and exports telemetry data. It offloads processing responsibilities from production application runtimes—handling batching, trace filtering, data sanitization (removing PII), tail-based sampling, and data compression—before fanning out the traces to one or more backend visualization tools simultaneously.
Q2: What is the difference between head-based and tail-based trace sampling?
- Head-Based Sampling: The sampling decision is made at the start of a request (at the root span) before the full transaction completes. While lightweight, it risks discarding rare 5xx errors or high-latency traces that develop later down the service chain.
- Tail-Based Sampling: The sampling decision is deferred until the entire distributed trace has finished executing. The OpenTelemetry Collector buffers the complete trace, inspects its downstream spans, and guarantees that 100% of errors or traces exceeding latency thresholds (e.g., >1000ms) are retained for analysis while discarding mundane successful queries.
Q3: Does adding OpenTelemetry distributed tracing degrade application runtime performance?
When properly configured, OpenTelemetry instrumentation introduces negligible overhead (typically less than 1–2% CPU and sub-millisecond latency per hop). By offloading serialization and network export to an asynchronous local collector daemon running as a sidecar or daemonset, the main application thread remains unblocked.
